
Vera
Take control of menopause through data and personalized resources.
Overview
Vera is a body literacy tool to help people understand what’s happening to them during their own unique menopause. This was a group Capstone project in the MHCI+D program where I provided research guidance and strategy and really owned the storytelling and the concept. The highlight for this project is really about leaning into formative research to unlock new insights about the context and respond to the right problems.
Project context
Time Frame: March 2018 - September 2018 (6 months)
Team: Lan Vu and Agatha Tutia
Sponsors: Smashing Ideas and Etsy
Key Contributions: UX design, storytelling, information hierarchy, prototyping, journey maps, empathy maps, personas/archetypes, research guidance, participant recruitment, literature review
Why menopause? Female health is rich with technology opportunities, because it is under supported in today’s society, but can be aided by data and information. When my team began exploring female health topics, we realized all three of us knew next to nothing about menopause, even though all of our mothers had recently gone through it.
What is menopause? During menopause, one might experience hot flashes, insomnia, vaginal dryness, loss of libido, mood swings, weight changes, exacerbated mental health conditions, dry skin, and irregular menstruation. It is easy to want to medicalize these changes, but although they are highly uncomfortable and deserve relief, because menopause is a natural transition, we chose to refer to the accompanying experiences as “signals” rather than “symptoms”.
Silently enduring
Menopause is typically dealt with in silence and every experience is highly variable, so many people feel confused and helpless when they discover unexpected changes to their bodies.
Vera gives menopausal people control over their bodies by providing an outlet for questions and discovery.
Uncovering a community of surprised and uniquely uncomfortable people
Recruitment
In addition to 6 experts, we spoke to over 30 menopausal women over the course of this project.
For recruiting, I designed the flyers, contacted about 40 people directly via Facebook, and managed most of the scheduling. We had over 40 responses to our screener, conducted 9 semi-structured interviews, held a workshop with 8 women, and conducted 15 concept-based evaluations.
Semi-structured User Interviews
After familiarizing ourselves with the space by Googling and reading academic qualitative work on menopause, we began our primary research by conducting semi-structured interviews to find answers to three research questions:
1. What are the current knowledge gaps and what current efforts exist to fill them?
2. What non-medical strategies do people currently use for coping and comfort?
3. What are the emotional support structures for menopausal people and in what ways do they feel unsupported?

We sat down with 6 cis-gender women to have this conversation. Our biggest takeaway was that each experience was very different. Many diverse signals, personalities, and contexts lead to a huge variety of menopausal experiences.
Workshop
While the goals of the interviews and workshop overlapped, we thought it was important to see how community and shared experiences can make an influence, so we created a community for 2.5 hours on a Saturday afternoon in the MHCI+D studio.
We had the participants write a letter to their pre-menopausal selves, discuss their letters and other challenges in a focus group, and participate in a post-it note activity where they organized their thoughts about menopause and prioritized areas they would most like to see improved.


The workshop revealed that when asked about what issue the women prioritized for themselves as individuals, they gravitated toward health and comfort issues that tended to be relatively unique to themselves, but when asked about the greater menopausal community, they prioritized creating positive attitudes, spirituality, and less stereotypes about menopause.
Insights
After 3 final interviews, we gathered what we had learned over the past 10 weeks of research, and synthesized our insights. Of our 8 major research insights, there were 4 that had the greatest impact on our design response.

Menopause is highly variable between individuals, making it difficult to identify a “typical experience.” Current scientific research is limited, which contributes to the sense that no one knows what is “normal”.
“Oh, you’ll have all these various symptoms that might be generally true but it’s really unique and the severity, the frequency, all those things can be really unique to a person.” - W3

Since there are no clear expectations of menopause, women often feel uncertain about “the Change,” both before beginning their experience and during it. There is a lack of clarity around menopause timelines and what to expect next. This mismatch between expectations and realities can lead to frustration or isolation.
“I wish someone (a doctor or any educated person) would have told me what I would (or could) experience later in the menopause state.” - W7

Menopause is a quality of life issue aging women are expected to silently endure, so there is a lack of interest in creating a broader discussion about it. When women do share their experiences with others, they discover relief through acknowledgement, a sense of legitimacy, and information exchange.
“So it’s just like what women do: we suffer in silence.” - P4

Women can feel a greater sense of control through understanding their body’s behaviors, because when they can attribute a biological change to menopause, they can a) seek resources and treatments, and b) manage its effect on her self image and social responsibilities.
“I’ve educated myself about it and I feel like I’m armed a bit more.” - P8
Proactive seekers of body literacy
Archetypes
Throughout our primary research, four distinct behavioral archetypes (i.e. personality types) emerged. To create these archetypes, we collected some of the primary features of our conversations with each of our seventeen participants and looked for important trends and similarities between participants.

The archetype that jumped out to us was "The Explorer". She represents an opportunity, illustrated by our insight that "body literacy creates agency".
“I wish I would have been armed with more information and been able to immediately say, ‘Oh, this is what’s happening’.”
Personas, Journey Maps, and Empathy Maps
From the four archetypes, I created personas with journey maps and empathy maps to create a story that was easy to relate to.
To view more details about our entire research process and outcomes, please see our research report.
Considering the many opportunities
Ideation
Entering ideation, we defined 4 potential opportunity spaces which resulted in over 100 concept ideas between the 3 of us.


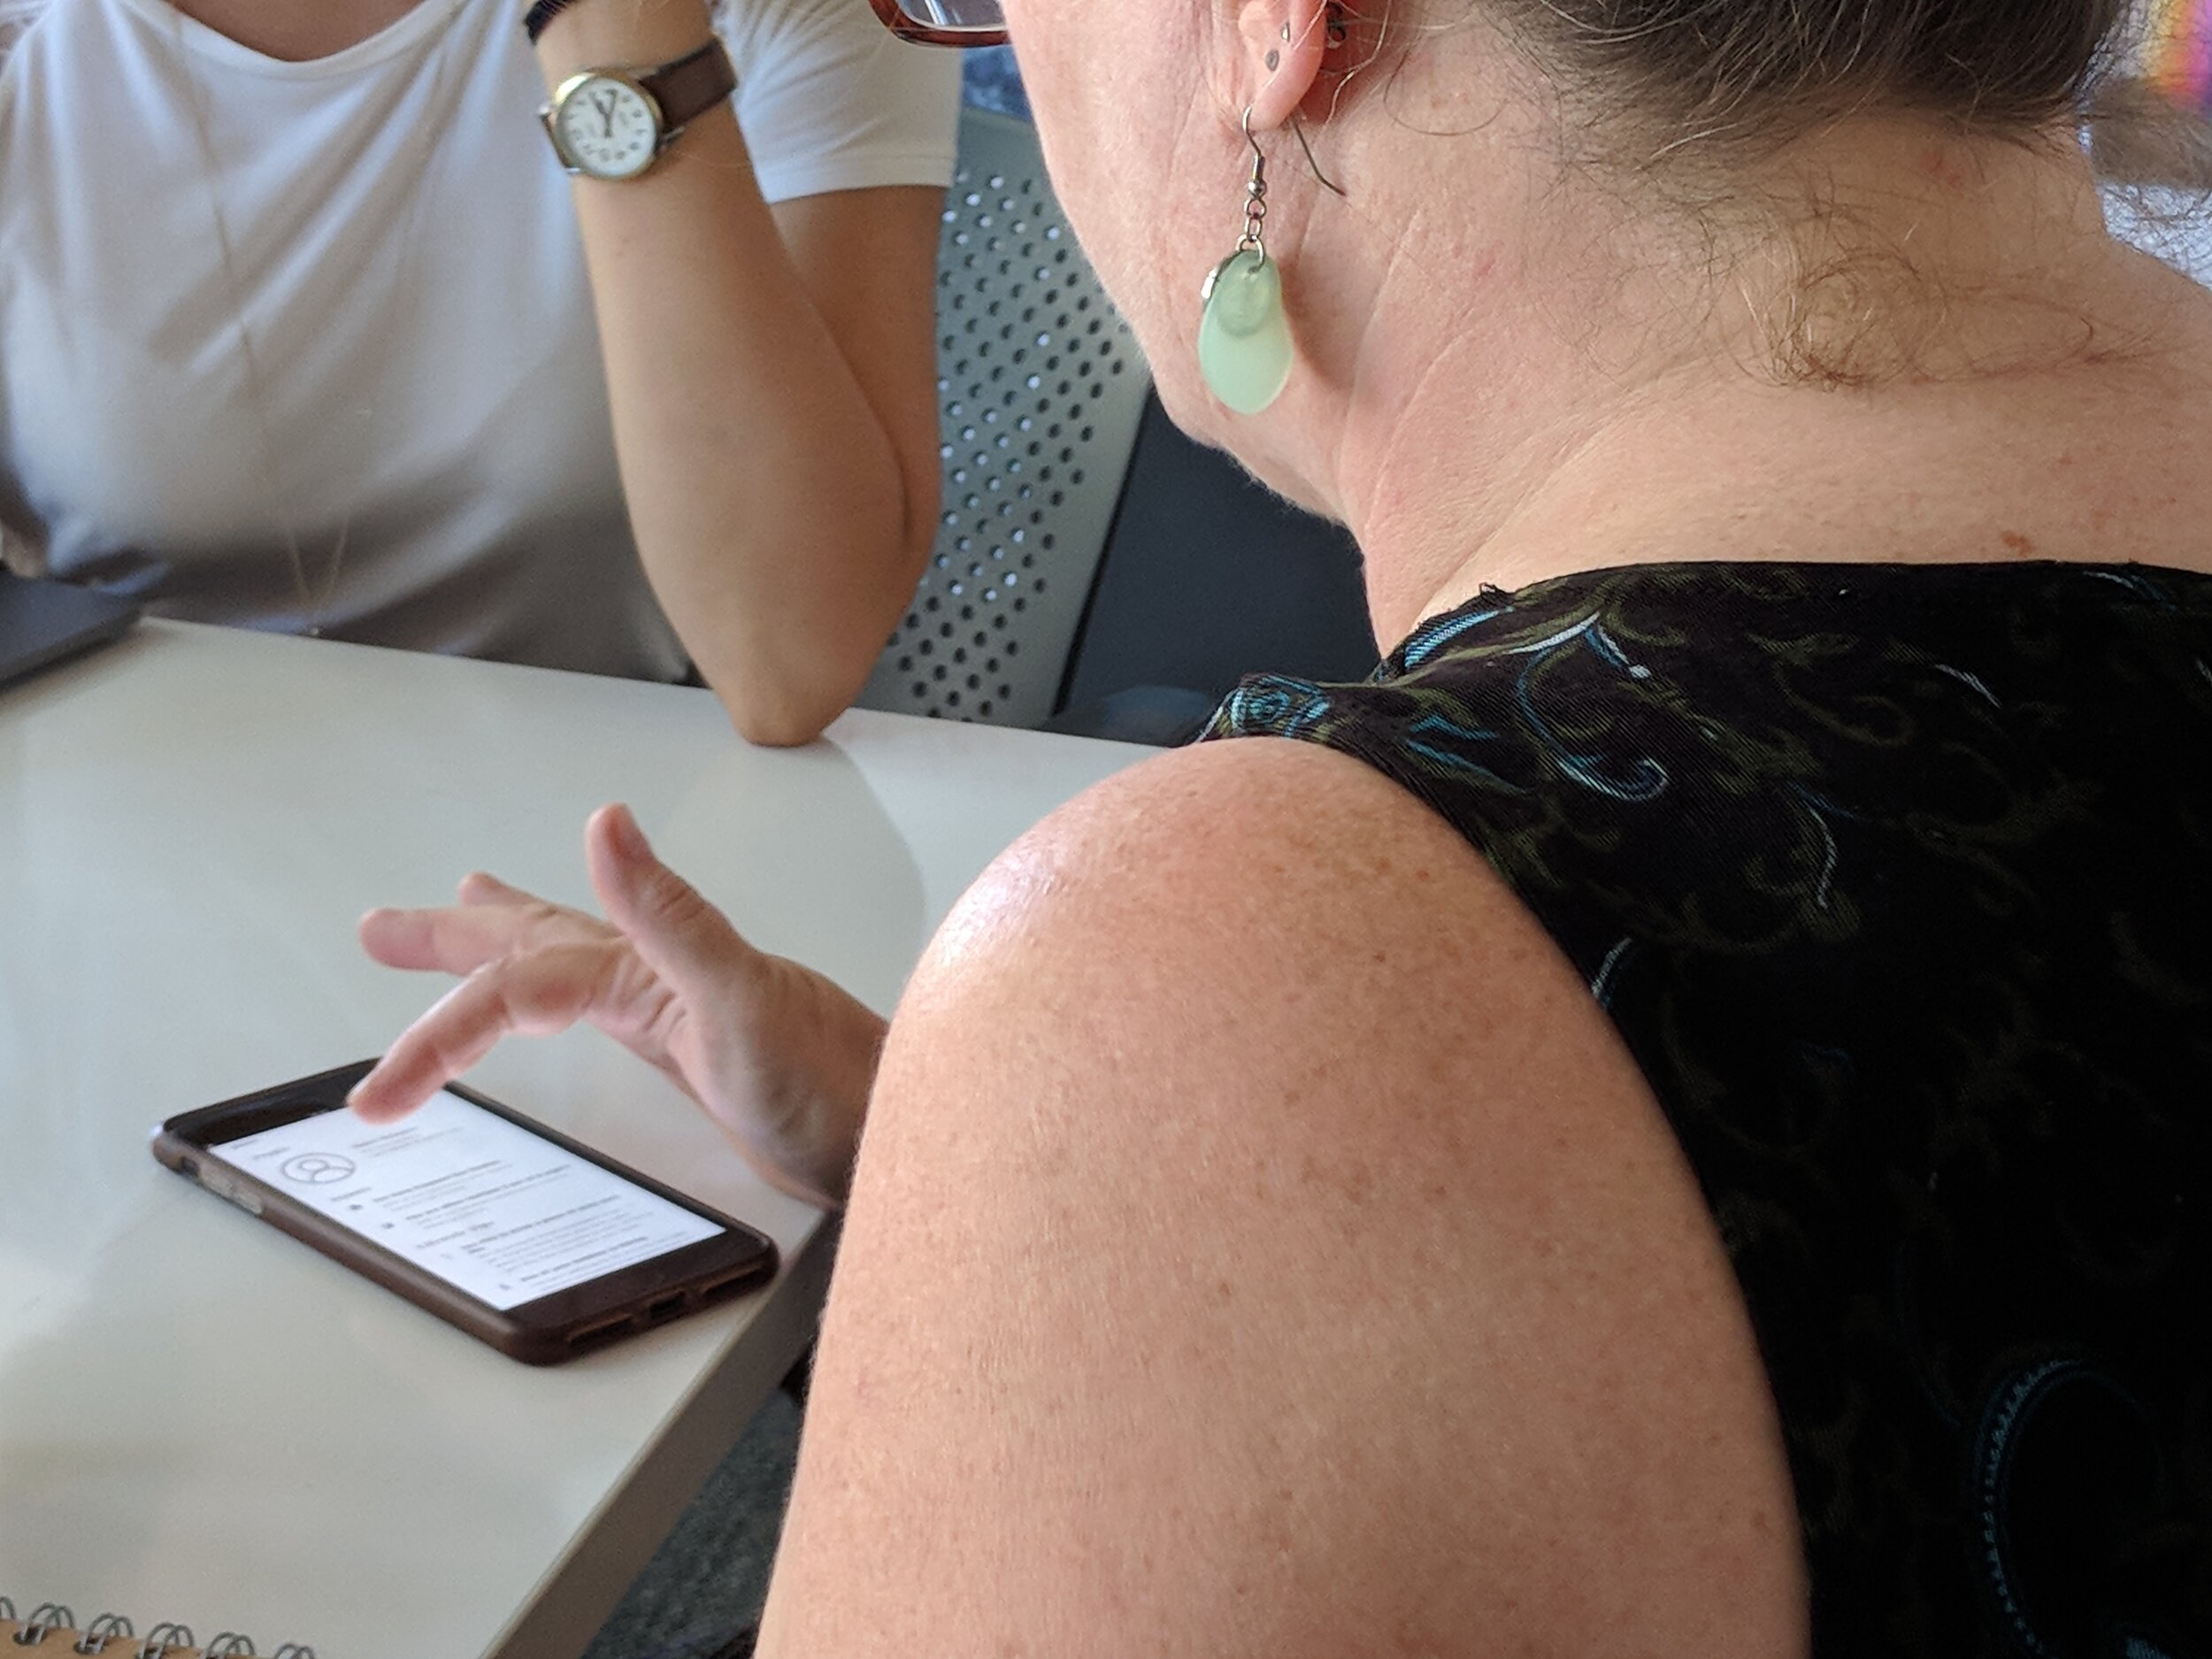
Concept Testing
After we chose and refined 5 concepts, we evaluated them with 5 menopausal people through guerilla recruitment at Green Lake.

Subscription Box: A paid subscription service that provides personalized products to menopausal individuals.
Takeaways: There was a lack of excitement around this idea and a concern about price. At best, people said they might use the associated website for ideas for products to buy on their own.

Social Events: A website where one can host or attend a menopause-related event.
Takeaways: People preferred to talk to existing friends + family, rather than to strangers.

Our Stories: An interactive website where menopausal people can share and interact with stories.
Takeaways: The people we spoke to felt that storytelling and support was less actionable than information or comfort-based solutions.

Lifestyle Website: A portal through which people experiencing menopause could complete surveys to get personalized feedback and resources.
Takeaways: This landed pretty well with our participants, especially the customized learnings. This felt very practical and useful.

Smart bra: A smart bra that collects heart rate data and can cool a person down during a hot flash. It is paired with a mobile app to visualize hot flash patterns.
Takeaways: This had the strongest reaction from participants, though we suspected that this may have had something to do with the novelty of a bra. There was a great deal of excitement about a personalized portal, which applied to both this product and the lifestyle website.
After reviewing the feedback, we ranked the potential features for our response, and realized we needed something that responded to both the variety of experiences and the lack of information and expectations. We landed on a mixture of the last two concepts: a personalized information/resource platform that provides knowledge about what an individual's unique body is doing via questionnaires and tracked data about signals and triggers.
Making it make sense
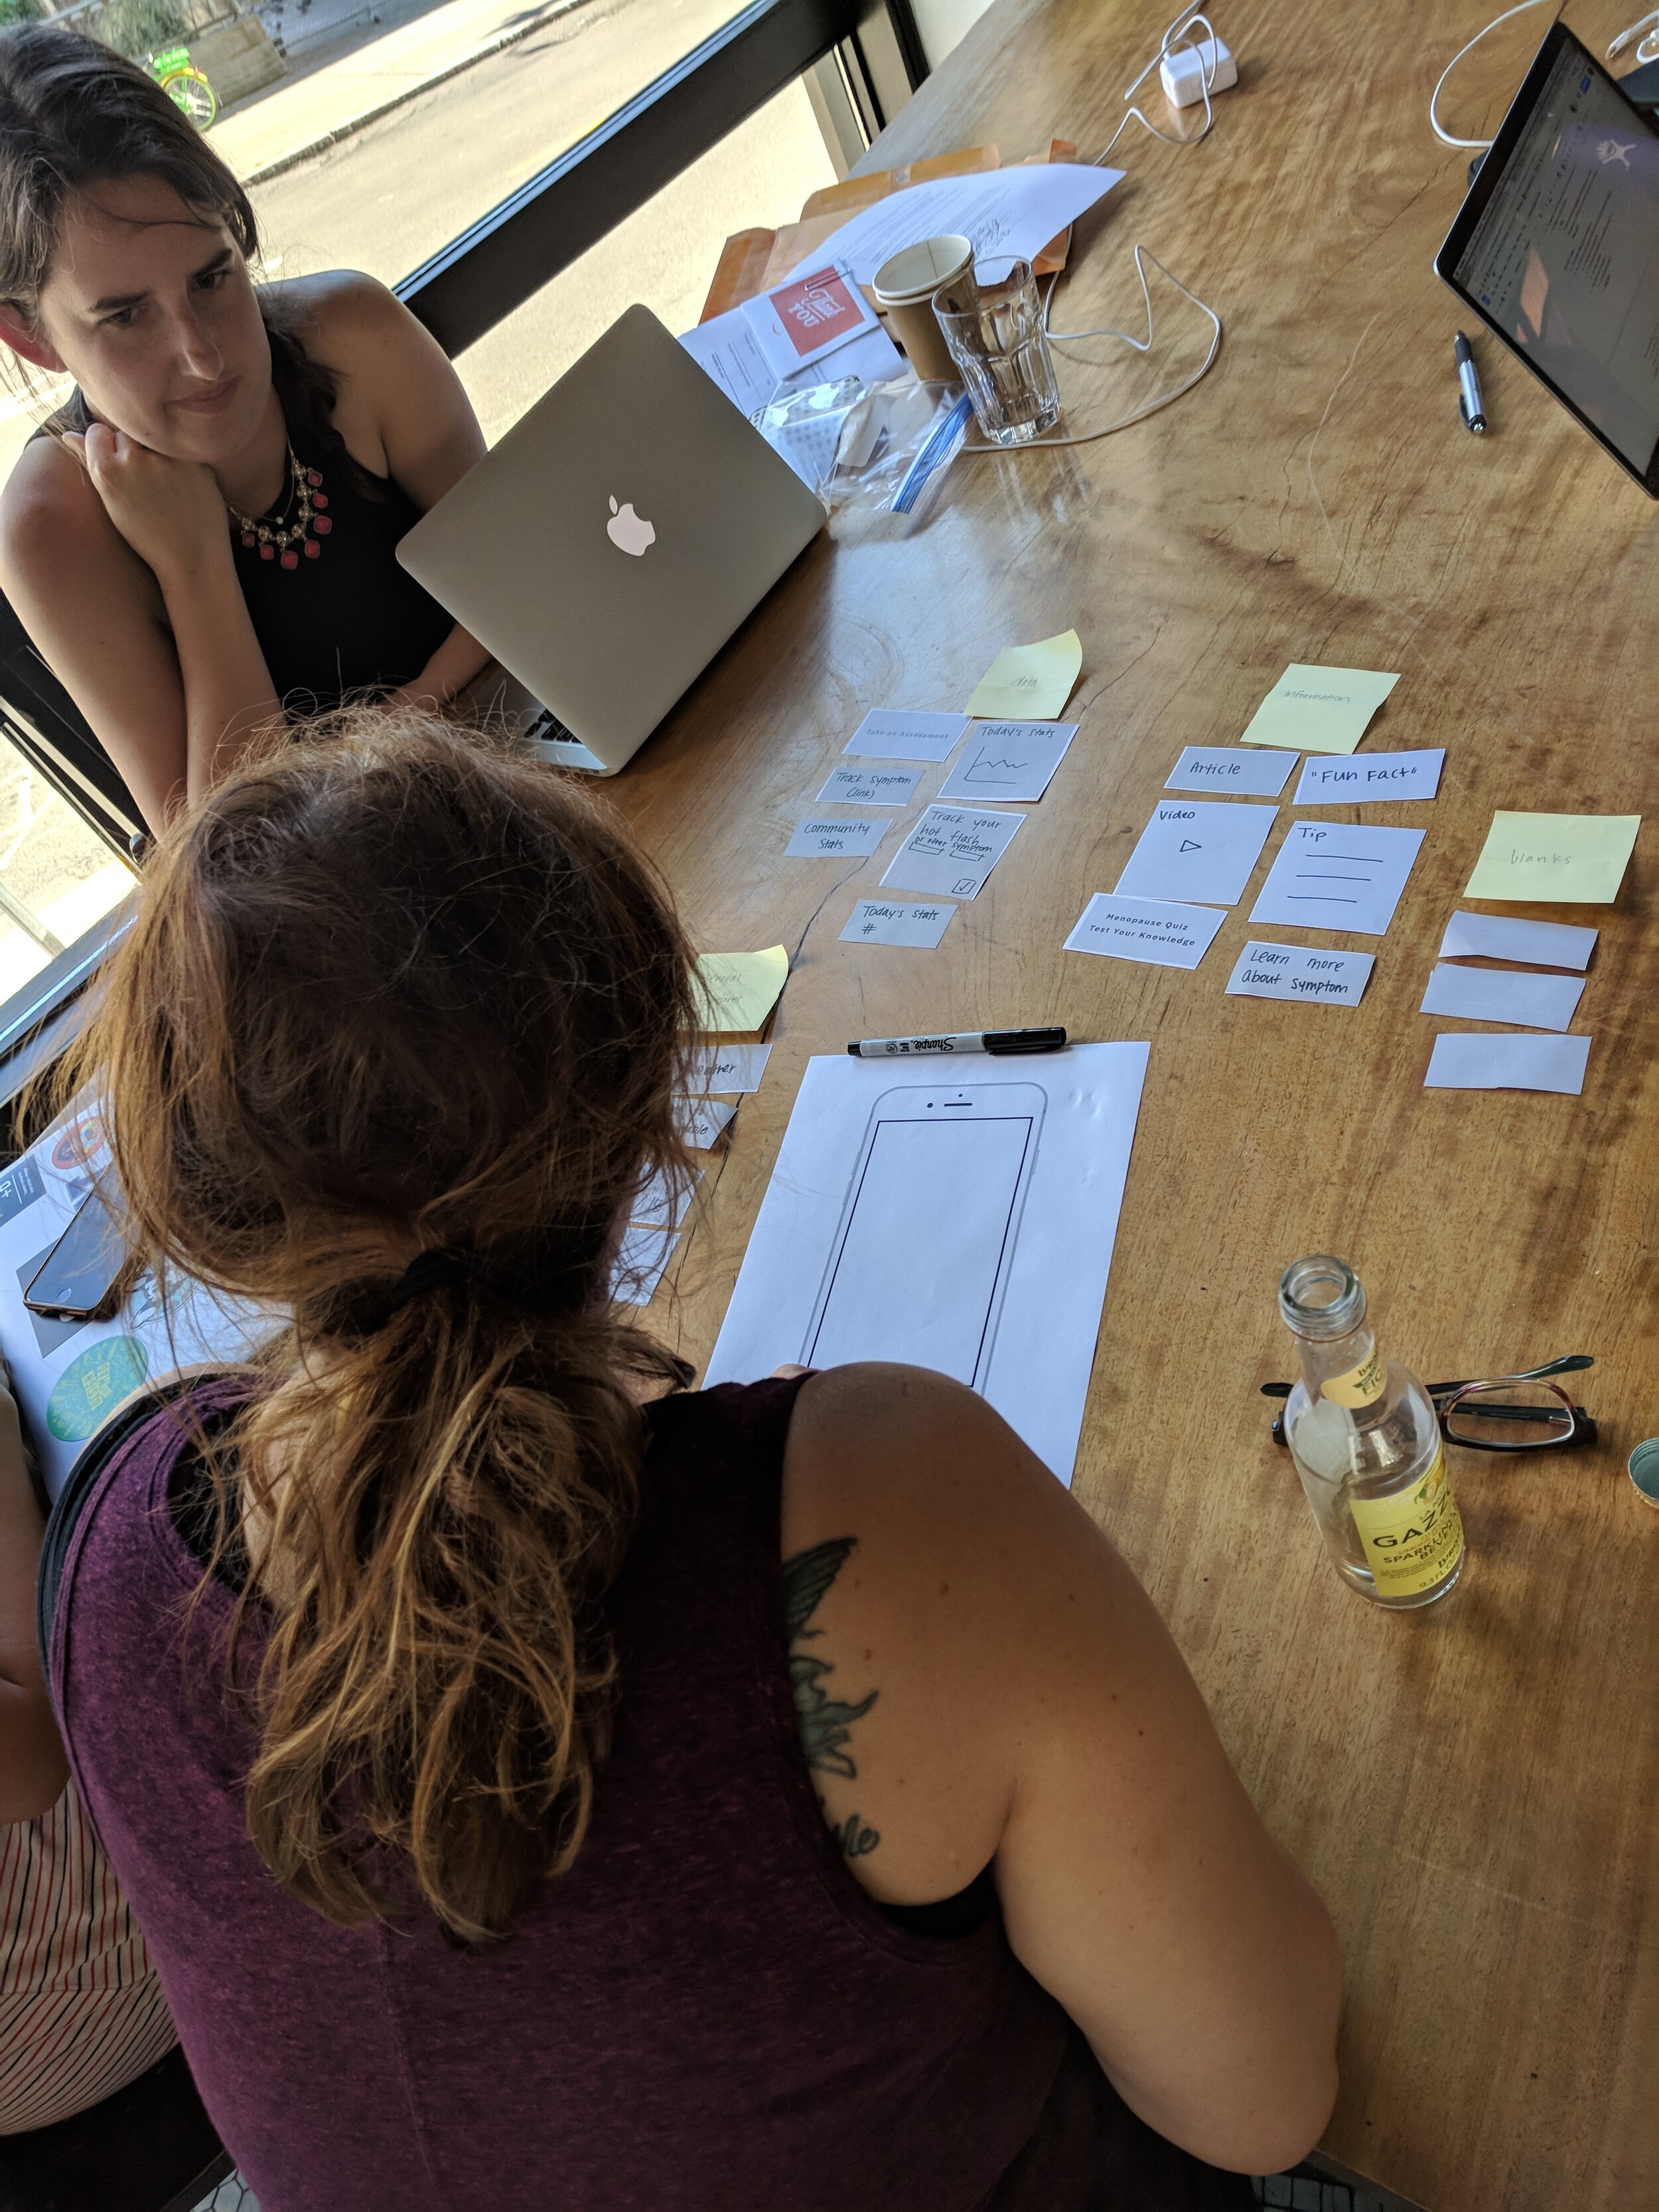
Wireframing
Our wireframes tested user interest in this concept and helped us begin to understand how our users’ goals could inform our information hierarchy and site map.
I was responsible for creating the screens for reviewing and inputting data, so I made variations of each that our participants could compare.
Card Sort
Because we were supporting in-app tracking (in addition to syncing data via Apple Health and any other wearable or mobile application that tracks relevant data), we were not sure whether to lead with a tracking form, the recent data, the available questionnaires, or the related resources and information. We conducted a card sort for the opening screen and decided to lead with recent data and an easy link to track something.
Prototyping
We used our high fidelity prototype to validate that the application's visual language made sense and that the product was easy to use. This time, I was responsible for the Information Feed and the Assessments flows, along with creating a clickable prototype via InVision.


For Assessments, I learned that we needed to display more options up front by making the mini-cards smaller. Additionally, the purpose of Assessments was confusing, so I later added an explanatory blurb to the first screen.
"The word “assessments”... I’m not sure what that measures. Maybe it would rate where I stand? With other people? ... I still don’t get this page." - H3

I wanted to provide small rewards like stats, tips, and readings after a user takes an assessment. During testing, the Comparisons and Readings were especially popular.
“That’s cool, you want to see where you are. It’s human nature, you want to see how do I compare to everyone else.” - H1
We chose to remove the Tips in future iterations, because it was hard to prevent these tips from being condescending or unhelpful.

The Feed tested well. Later changes were due to a shift in the overall product's visual language.
"The colors draw my eye in. The illustrations are pretty." - H2
"I like how these are color-coded" - H5
A complete and personalized experience
Tracking menopause signals and triggers is easy to do.
Your Vera experience is completely personalized to you.
Your exploration and understanding of your body is our primary goal.

Vera is breaking the taboo.
Aging women and menopause are devalued in this society. Vera would not only give some attention and support to a group of people who are otherwise disregarded, but it would use the data it collects to advance statistical research efforts that could result in new treatments and expectations.
To view more details about our visual language, flows, and mockups, please see our UI Spec.
Reflections
What I learned
Creating personas and journey maps is a sensitive task. I began the endeavor because menopause translates well to a journey map -- it's an experience with ups and downs. However, in order to communicate the variety of experiences, I needed archetypes and personas to illustrate a few paths, and empathy mapping to describe the journey in more detail. The task quickly ballooned, and still I hope my work has not trivialized all of the unique experiences women have. The discovery of the "Explorer" archetype was pivotal to our design direction.
Share what you've done! Our research made us experts on menopause and how our participants respond to it. During the design phase, it quickly became clear to us that we would have an easier time coming to consensus with our advisors and stakeholders if we brought this knowledge forward. It was very effective to include some of our core insights or quotes when we presented our design direction.
Next steps
Publish our research at CHI or a similar academic conference. There are only 5 HCI academic papers about menopause, so there is a huge opportunity to design and discuss this space. We did this!
Turn our attentions to data visualization. A big part of the impact of this product would come from the effectiveness of the data visualizations, and there is still room to evolve and enhance the data experience.
As a whole, I found the problem space to be continually engaging and inspiring. This project changed the way I think about health literacy and personal health, because I now understand that a connection to one's body can be deeply empowering.